Why property assessments feel slow, subjective, and expensive
A typical assessment starts with scheduling, access, travel, and a checklist that changes slightly depending on who shows up. Even when two professionals agree on the big things, they may record condition and quality differently because they’re balancing incomplete information, local norms, and time pressure. Photos help, but they’re often inconsistent in angle, lighting, and coverage.
Scale makes it worse. When portfolios or jurisdictions require thousands of properties, small judgment calls turn into large swings in totals. Re-inspections, owner disputes, and missing documentation add days or weeks, especially when different teams handle field work, review, and final sign-off.
Cost follows friction: labor hours, mileage, vendor coordination, and the opportunity cost of delayed decisions. The constraint is that cutting corners can increase errors and liability, so “faster” usually means “riskier” unless the workflow becomes more standardized.
What computer vision can reliably see on a property
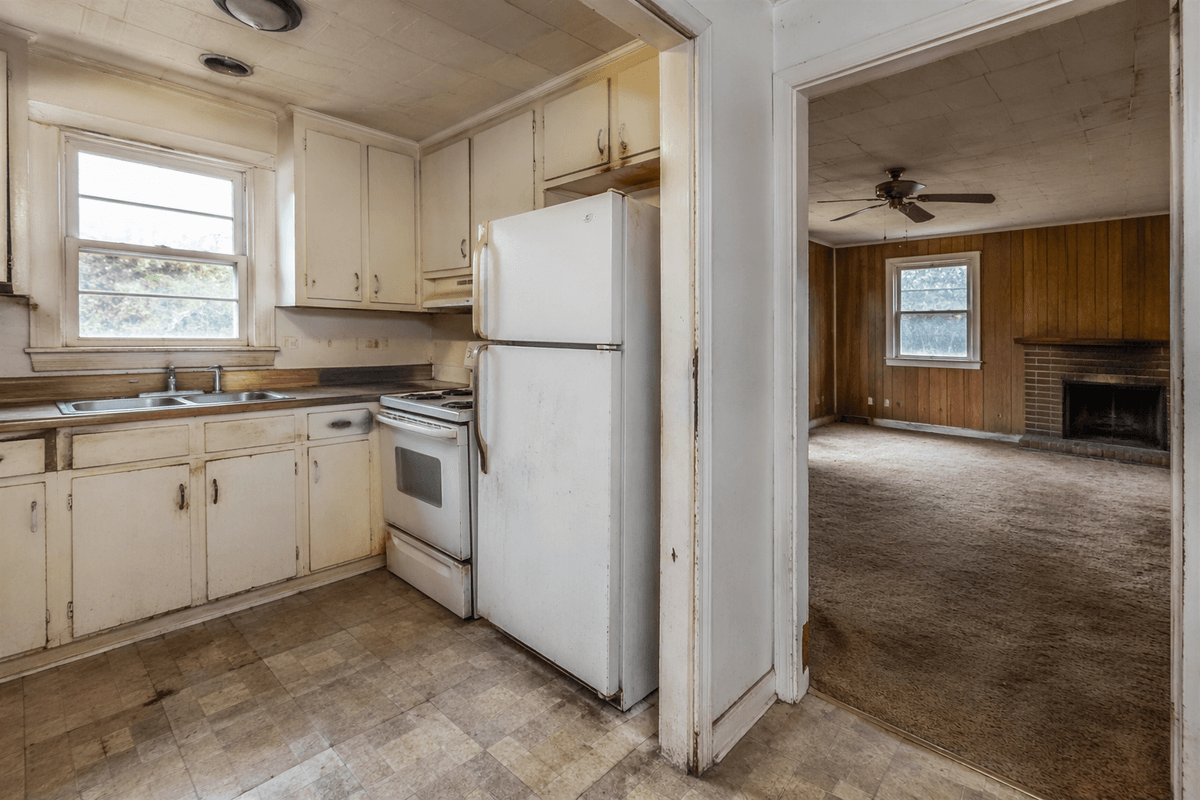
Stand in front of a property with a phone and you’ll notice the same things a decent vision model can: roof geometry and visible wear, missing shingles, ponding risk cues on low-slope roofs, siding material, window counts, obvious cracks, driveway condition, fencing, and vegetation encroachment. On interiors, it can usually distinguish room types, flooring and countertop materials, major fixture presence, and broad condition bands like “freshly renovated” versus “heavily worn.”
Where it tends to be most reliable is feature extraction that is visual and repeatable: counting, classifying, and flagging defects that have clear patterns. It’s less reliable when the question is judgment-heavy, like workmanship quality, hidden water intrusion, or whether a space feels “premium” for the submarket.
Inputs still govern outputs. Poor lighting, wide-angle distortion, clutter, seasonal coverage, and outdated photos can produce confident-but-wrong results, so most teams treat vision as a fast first pass with a human exception lane.
From phone photos to usable assessment data: the workflow
Most workflows start with guided capture, because “good enough” photos are rarely good enough for consistent measurement. A simple in-app checklist (front elevation, roof edges, each side, major mechanicals, each room corner) reduces angle gaps and gives the model multiple views to cross-check. Metadata matters too: timestamp, rough location, and whether images came from a walkaround, drone, or prior listing, since mixing sources can quietly skew condition calls.
Once images land, the system typically runs three passes: (1) quality screening to reject blurry, dark, or incomplete sets; (2) feature and defect extraction (materials, counts, visible damage cues); and (3) normalization into your schema—matching “asphalt shingle, moderate wear” to the exact dropdowns and condition bands your team uses. The output is rarely a single “score”; it’s a structured packet with confidence levels, annotated images, and a short rationale that a reviewer can audit quickly.
If you can’t standardize capture—tenant units, gated backyards, winter snow load, or rushed contractors—the exception rate climbs and the savings shift from “fully automated” to “faster triage,” which still helps but requires staffing a review lane.
Accuracy you can trust: validation, QA, and exceptions
Accuracy starts to feel “real” when outputs are scored, sampled, and compared to a ground truth you already trust. For feature extraction, that might be a set of recently completed field inspections, permit closeouts, or adjuster reports—anything with consistent definitions. A useful vendor will show performance by class (e.g., roof material, missing shingles, window count) and by capture conditions, not just one blended number, because glare, snow cover, and steep pitch tend to fail in predictable ways.
QA usually works best as a tiered review lane. High-confidence, low-impact fields can flow through with light sampling. Anything low-confidence, unusual (solar, tarp, partial tear-off), or high-impact (major damage flags, condition band changes) should route to a human with the annotated photos and the model’s rationale. The practical cost is that this requires ongoing calibration: periodic re-labeling when standards change, retraining for local housing stock, and a documented escalation path for disputes so “AI said so” never becomes the justification.
Handling privacy, compliance, and bias in visual assessments
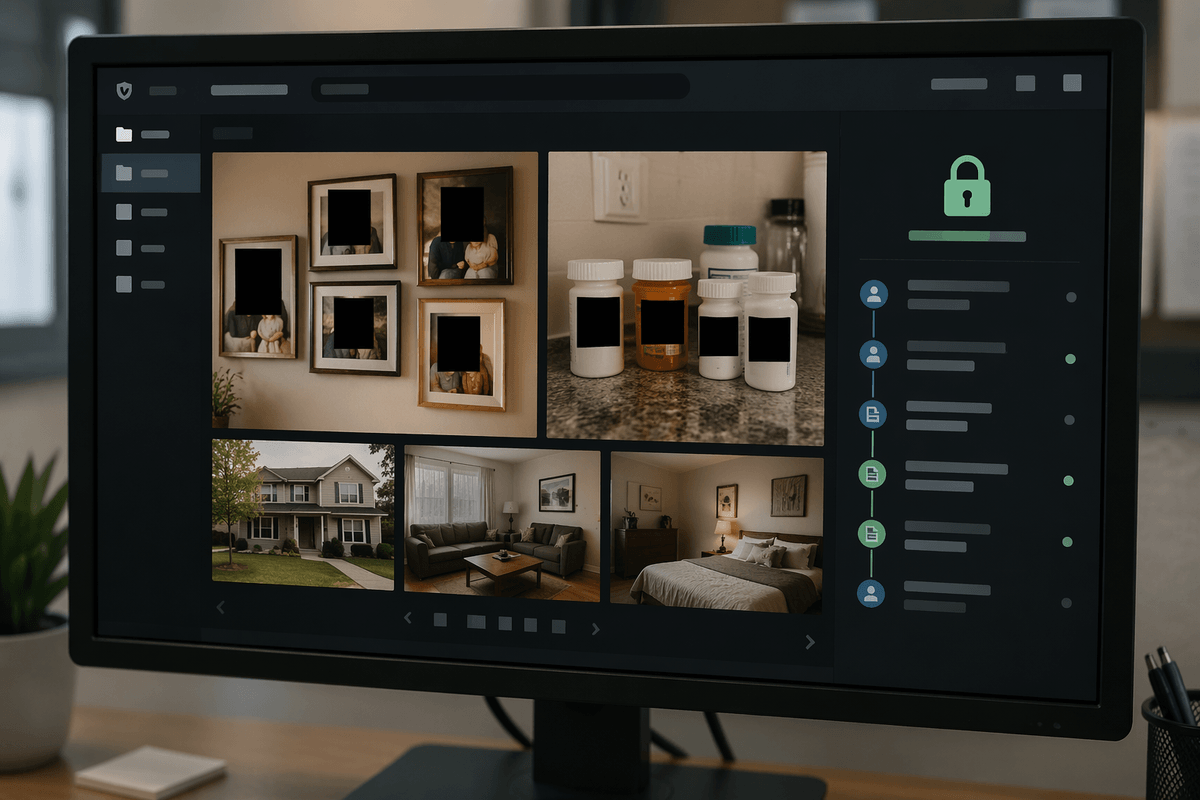
Everyone involved has seen the same friction point: a photo set that helps valuation also captures faces, license plates, family photos on a wall, medication bottles, or a neighbor’s yard. The safest posture is to treat images as regulated records, not “just pictures.” That means minimizing capture to what you actually need, redacting or blurring sensitive elements by default, setting short retention windows for raw media, and logging who accessed what and why. If a vendor can’t explain where data is stored, how it’s encrypted, and how deletion works in practice, you’re inheriting their risk.
Compliance is mostly about process discipline. Written consent language, clear purpose limitation (tax assessment vs. insurance claims vs. maintenance), and a repeatable dispute workflow matter as much as model accuracy. The real-world cost is operational: training field staff, maintaining chain-of-custody, and handling public records requests without exposing unnecessary imagery.
Bias shows up less as intent and more as uneven failure rates: older housing stock, dense vegetation, low light interiors, and lower-quality phone cameras can produce more “unknown” or harsher condition flags. Require performance reporting by neighborhood proxies, property type, and capture quality, and keep humans responsible for high-impact calls so automation doesn’t quietly shift outcomes.
Choosing the right use case: taxes, insurance, lending, maintenance
A familiar fork shows up quickly: do you need consistent, explainable attributes at scale, or do you need fast decisions on a smaller number of high-stakes files? For property taxes, vision tends to work best as a standardizer—updating exterior features, spotting major condition changes, and prioritizing which parcels truly need a site visit. It is weaker when statutes or local practice require interior confirmation, or when small visual cues can swing assessed value and trigger disputes.
Insurance and maintenance are usually the most straightforward fits because the questions are visual and time-bound: roof damage triage after a storm, pre-bind exterior condition checks, vegetation encroachment, or “before/after” verification on repairs. Lending sits in between. Vision can speed up collateral checks and renovation draw inspections, but only if your policy defines what photo evidence must show and when a human must confirm occupancy, habitability, or hidden defects. If you can’t reliably get the right angles on demand, you’re buying a triage tool—not full replacement.
Getting ROI without disruption: rollout steps and success metrics
ROI usually appears when you treat vision as a throughput tool, not a wholesale process change. Start with one narrow workflow where photos already exist (pre-bind exterior checks, draw inspections, post-storm triage), run it in parallel for 30–60 days, and define what can auto-pass versus what must route to a reviewer. Build your “exception lane” first: who reviews, how disputes are logged, and how overrides feed back into QA.
Measure success in operational terms: percentage of files with complete photo coverage, model pass-through rate, reviewer minutes per file, cycle time to decision, and downstream reversals (re-inspections, appeals, claim supplements). Include cost and risk: vendor fees, staff training time, and any increase in customer or taxpayer challenges. If exception rates stay high because capture is inconsistent, the best ROI lever is guided capture, not more modeling.