Why machine learning is showing up on factory floors now
Walk most plants today and you’ll see the same pressure points: tighter customer tolerances, more product variation, and less slack in staffing and downtime. Machine learning shows up now because those pressures created enough digital “footprints” to work with—PLC tags, vision systems, maintenance logs, and years of historian data—while compute and tooling have become cheaper and easier to deploy at the edge or in the cloud.
What changed isn’t that manufacturing suddenly became “AI-ready.” It’s that the economics moved. A few points of scrap reduction or a modest gain in OEE can justify focused models, especially when lines already generate high-frequency data. The plants still pay in sensor gaps, inconsistent part traceability, and integration time with MES/SCADA, which is why value tends to cluster in a handful of repeatable use cases rather than broad “AI transformation” programs.
Start with the production pain you can actually measure
A common failure mode is picking a use case because it sounds advanced—“optimize the line with AI”—instead of because it fixes a loss you can already see on a dashboard or in a daily meeting. Start with the pain that shows up as a stable KPI: scrap and rework by defect code, unplanned downtime minutes by asset, changeover time, first-pass yield, customer returns, energy per unit, or throughput loss tied to specific stoppages. If you can’t name the metric, its current baseline, and what “better” means in dollars per week, you’re not ready to judge whether a model helps.
Then narrow it to a decision you actually make: when to stop a machine, which lots to quarantine, which parameters to adjust, which PM to pull forward. ML is valuable when it changes that decision earlier or more accurately than your current rules. Keep the first target small enough to instrument and validate without disrupting production, because the hidden costs are data extraction, IT/security review, operator training, and time spent reconciling “why the model disagrees” with tribal knowledge.
Your data reality check: sensors, historians, and messy labels
You likely already have more data than you feel you can use. PLC tags stream at high frequency, historians store years of time series, and SCADA screens expose the signals operators trust. The reality check is that “available” doesn’t mean “model-ready.” Tags get renamed, units drift, sampling rates vary, and the most important context—recipe, SKU, tool, operator, lot, and shift—often lives in MES or spreadsheets that don’t line up cleanly with the historian timeline.
Labels are usually the bottleneck. Quality outcomes may be logged by defect code hours after production, maintenance notes are free text, and downtime reasons change with whoever is on shift. Even vision systems can be hard to use if images aren’t tied to a serial or timestamp. Expect time and cost in basics: agreeing on a tag dictionary, improving traceability, and building a repeatable way to join “what happened” to “what the sensors saw,” before any model can be trusted on the line.
Four high-impact ML use cases—and when each fits

You’ve probably seen vendors pitch dozens of applications, but most plants get real payback from four patterns. Predictive maintenance fits when you have frequent unplanned stops on a few expensive assets and enough run-time history to link condition signals (vibration, current, temperature) to failure modes. It’s weaker when failures are rare, components are cheap, or maintenance data is too inconsistent to confirm what “failure” actually was.
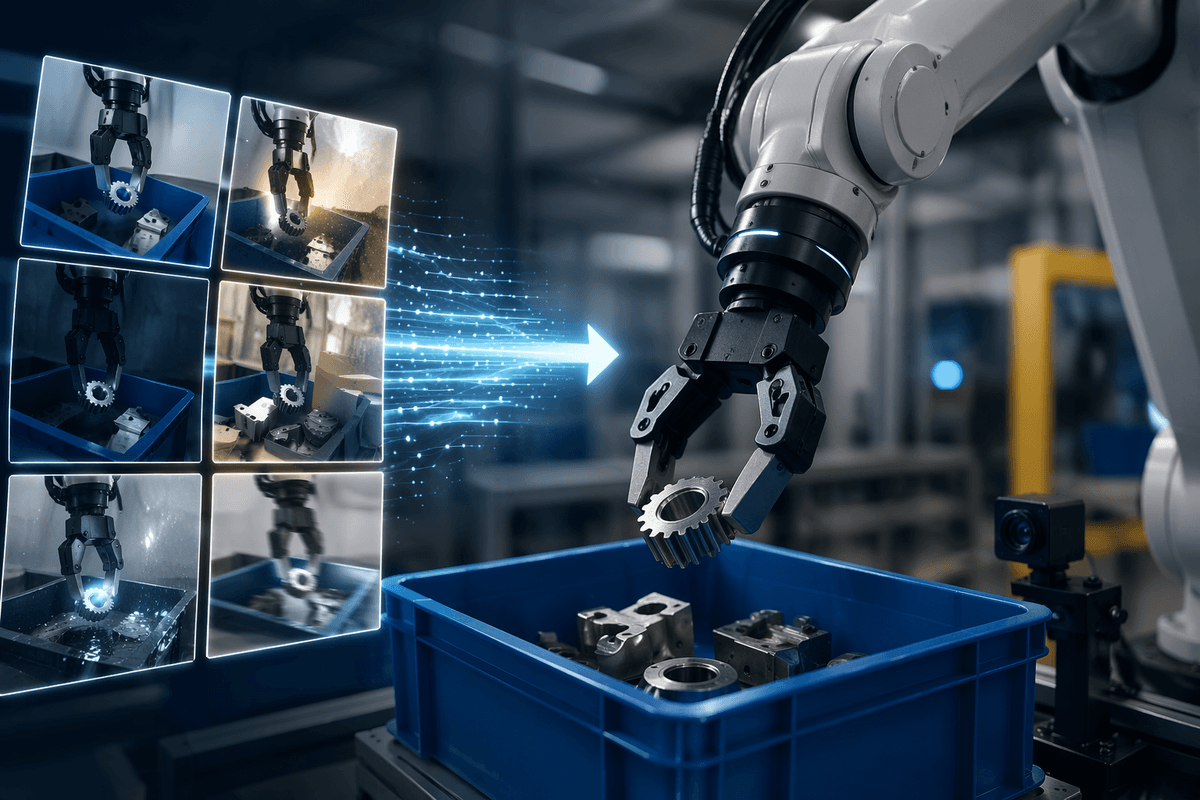
Automated quality inspection works when defects are visible and you can connect images or sensor traces to a unit, lot, or timestamp. It’s often the fastest way to reduce inspection labor and escape subjective calls, but it can stall if lighting, fixturing, and part presentation vary by shift and the plant isn’t willing to standardize them.
Process anomaly detection and root-cause support fit when the line already produces dense time-series data but the team is stuck chasing intermittent scrap or micro-stoppages. It doesn’t require perfect labels, yet it does require stable context fields like recipe, tool, and SKU to avoid false alarms.
Setpoint and recipe optimization fits when there’s a real trade-off—throughput vs. quality, energy vs. cycle time—and operators currently tune by feel. You need limits, approvals, and a way to test changes safely, because “better” on average can still create expensive outliers.
Build, buy, or partner: choosing a path without regrets
The real decision usually begins once a pilot is ready to leave the lab and support production. At that point, the question is no longer whether AI works, but what the business actually wants to own: a long-term capability, a quicker deployment, or a shared responsibility. Developing a solution internally makes the most sense when the advantage comes from proprietary knowledge—production methods, operating constraints, or unique failure patterns—and the organization is prepared to maintain data pipelines, monitor performance, retrain models, and support operations after deployment. That commitment extends well beyond model development, and it often competes with day-to-day engineering priorities for both time and specialized talent.
Commercial platforms are strongest when the problem is already well understood, such as visual inspection, vibration monitoring, or general anomaly detection. Even then, the evaluation should extend well beyond demonstration accuracy. Questions about historian or MES integration, sensor compatibility, tag management, and support for new production lines or SKUs tend to reveal far more about the long-term effort than benchmark results. Licensing models, integration work, and responsibility for future model updates are often where project costs become clearer.
A partnership frequently offers the most balanced path when speed matters but complete dependence on a vendor is undesirable. The strongest partners help demonstrate business value while transferring enough knowledge for the internal team to operate and extend the system independently. Success should be measured against plant outcomes rather than model metrics alone, with a clear operating rhythm involving engineers and production staff, supported by maintainable pipelines instead of a handoff that consists only of a trained model and presentation slides.
From pilot to line-wide rollout: what changes in practice
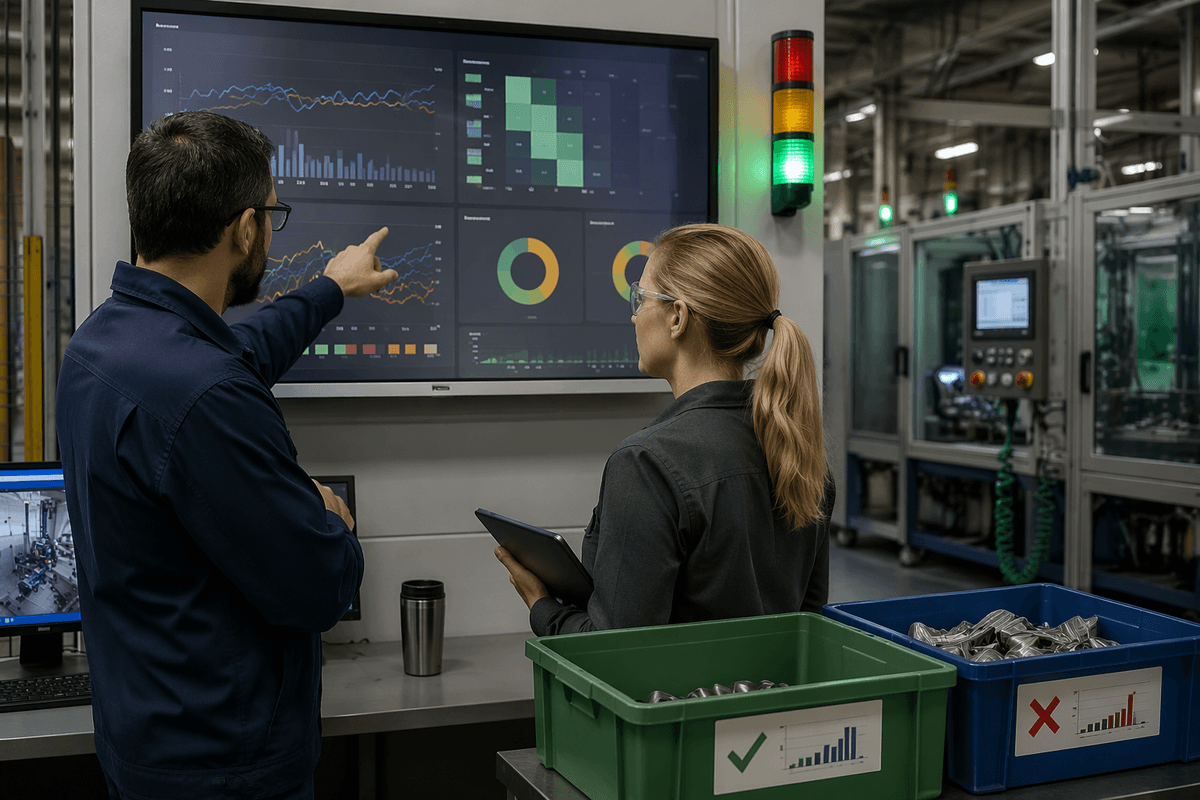
The pilot usually proves a narrow claim—“this model flags likely defects”—but rollout forces you to prove it under shift changes, product mix swings, and routine maintenance. You move from a one-time dataset to a living data pipeline: stable tag mappings, automated joins to MES context, and monitoring for drift when sensors are replaced or a recipe changes. You also need a fallback when data drops out, because production can’t stop for a model outage.
Validation changes too. Instead of a single accuracy number, you track decision impact: avoided downtime minutes, reduced quarantine volume, fewer false stops, and how often the model is ignored. That means controlled trials, clear thresholds for action, and a way to review “model vs. reality” weekly with engineering and quality.
Costs become visible at scale: integration to SCADA/HMI, cybersecurity review, licenses per line, and operator training. Rollout works when you standardize the workflow—alerts, escalation, and ownership—so each new line is mostly configuration, not reinvention.
People and process: making ML usable for operators and engineers
On the floor, a model only helps if it fits the way work already happens. Operators need a clear prompt tied to their controls: what to check, what to adjust, and when to escalate. Engineers need the same alert anchored to evidence—recent tag trends, comparable past events, and the process limits that define “safe.” If the output is a probability with no context, it becomes a debate, then gets silenced.
Define ownership like any other reliability or quality practice: who acknowledges alerts, who closes the loop with a disposition code, and who updates rules when the process changes. Treat labels as part of standard work—lightweight, consistent reasons for downtime, scrap, and overrides—because that’s what keeps the system improving instead of drifting.
Adding screens to an HMI, training across shifts, and creating time for weekly review all cost capacity. Start by reducing operator burden: fewer, higher-confidence alerts and a simple “helpful/not helpful” feedback button that feeds engineering follow-up.
A practical roadmap to capture value in 90 days
Picture the next 90 days as a tight loop from one measurable loss to one repeatable workflow. Week 1–2: pick a single KPI (scrap, downtime minutes, false rejects), name an owner, and lock the baseline and the “action” the model will trigger. Week 3–5: build the dataset join (historian + MES context + outcomes), fix the top tag/traceability gaps, and define a simple alert and disposition code.
Week 6–8: run the model in “shadow mode” on the live line, reviewing misses and false alarms in a weekly cadence with maintenance/quality/ops. Week 9–12: switch to limited production use with clear guardrails—thresholds, escalation, and a rollback plan—then quantify impact in dollars per week. The constraint to plan for is time: integration and label discipline usually cost more calendar than modeling.